Proteomics and phosphoproteomics bridge the gap between genome and phenotype — quantifying the proteins that actually execute cellular functions, measuring the post-translational modifications that regulate their activity, and mapping the interaction networks through which they coordinate biological responses. Mass spectrometry-based proteomics now enables the simultaneous quantification of thousands of proteins and tens of thousands of phosphorylation sites from a single experiment, generating datasets of extraordinary complexity that demand expert bioinformatics analysis. At BioinformaticsNext, we provide specialist proteomics and phosphoproteomics bioinformatics services — supporting cancer biology, drug discovery, clinical biomarker development, and fundamental cell biology research with rigorous, reproducible, and biologically interpretable protein-level analysis.
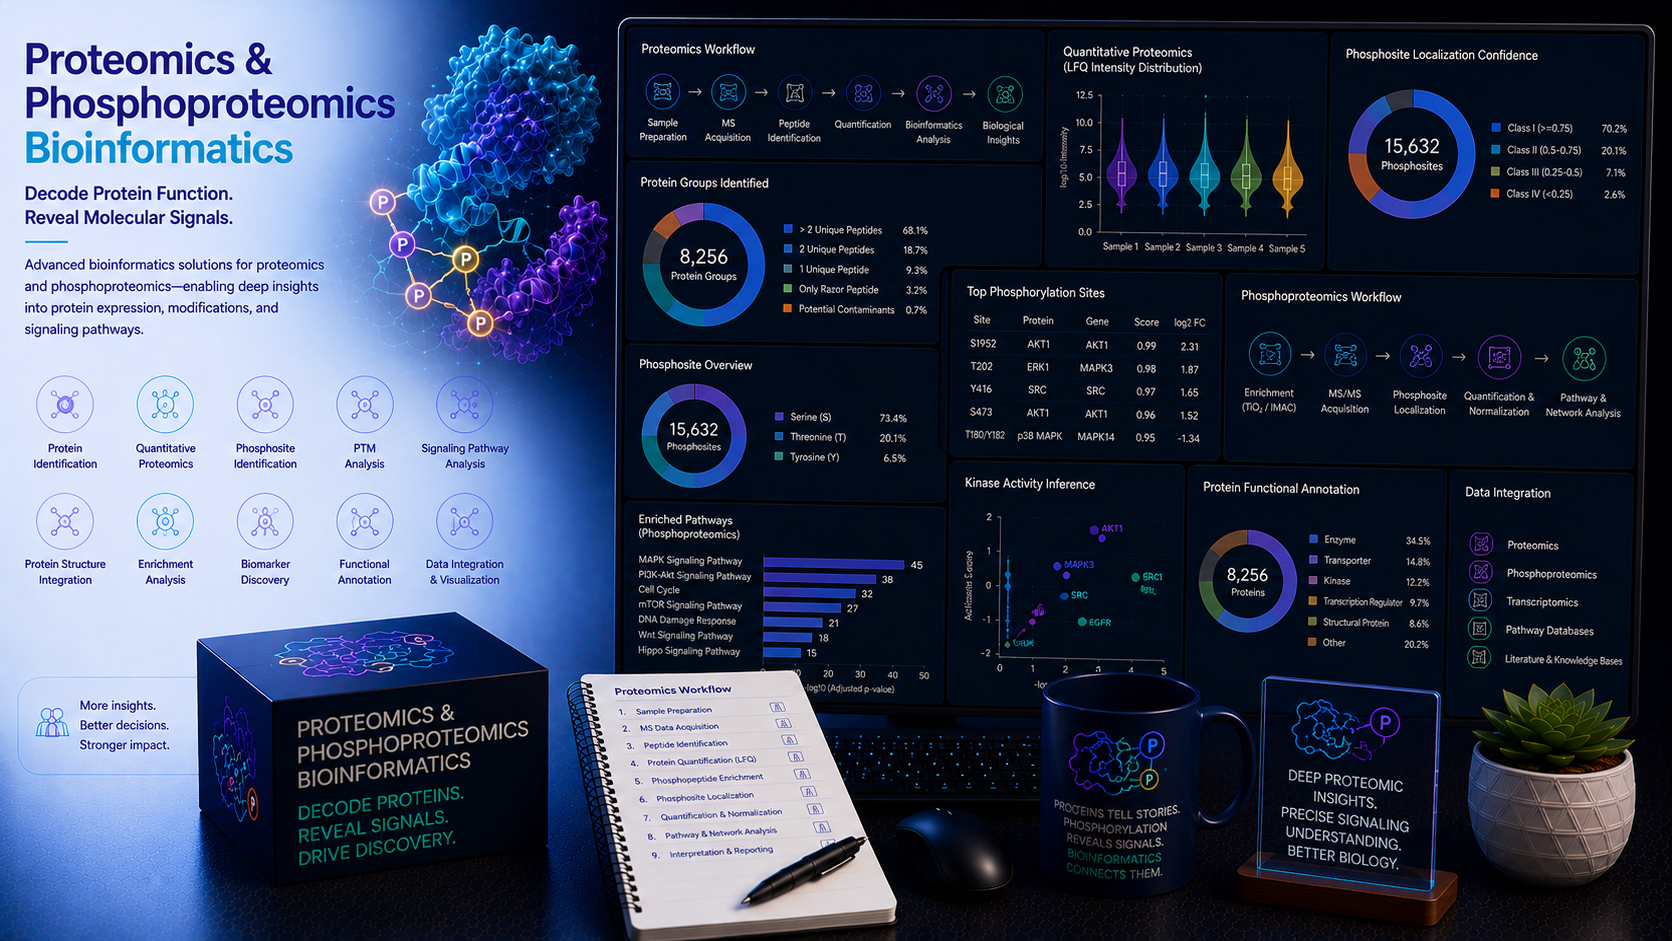
Proteomics & Phosphoproteomics Bioinformatics: Mass Spectrometry, PTM Analysis & Protein Networks
Expert bioinformatics for quantitative mass spectrometry proteomics, phosphoproteomics, post-translational modification analysis, protein interaction network construction, and multi-omics integration for drug discovery, cancer biology, and clinical research.
The proteome is the functional output of the genome — shaped by transcription, translation, post-translational modification, protein-protein interaction, and degradation into a dynamic, context-dependent molecular landscape that determines cell identity and behaviour. Phosphoproteomics in particular has emerged as a critical tool for understanding signalling network activation — mapping the kinase-substrate relationships and pathway crosstalk that underpin drug responses, resistance mechanisms, and disease states. Yet the scale and complexity of mass spectrometry proteomics data — tens of thousands of peptide identifications, missing values, batch effects, and the statistical challenges of high-dimensional biological variation — demands bioinformatics expertise that goes far beyond standard genomics pipelines.
At BioinformaticsNext, we provide the full proteomics bioinformatics stack — from raw mass spectrometry data processing and protein quantification through differential abundance analysis, PTM site localisation, kinase activity inference, protein network construction, and multi-omics integration — delivering protein-level insights that are statistically robust, biologically interpretable, and directly actionable for research and drug development.
What We Support
Comprehensive proteomics and phosphoproteomics bioinformatics across all major mass spectrometry acquisition modes, quantification strategies, and biological applications.
- Label-free quantification (LFQ), TMT, iTRAQ, and SILAC proteomics data analysis
- Data-independent acquisition (DIA) proteomics with spectral library and library-free approaches
- Phosphoproteomics: phosphopeptide identification, site localisation, and quantification
- Comprehensive PTM analysis: ubiquitination, acetylation, methylation, and glycosylation
- Kinase activity inference and signalling pathway activation from phosphoproteomics data
- Protein-protein interaction network construction and hub protein identification
- Proximity labelling (BioID, TurboID, APEX2) interactome data analysis
- Thermal proteome profiling (TPP) and drug target engagement analysis
- Clinical plasma and tissue proteomics biomarker discovery and validation
- Multi-omics integration: proteogenomics, transcriptome-proteome correlation, and phospho-transcriptome analysis
Our Proteomics & Phosphoproteomics Bioinformatics Services
Specialist mass spectrometry proteomics bioinformatics — from raw data processing and protein quantification through differential abundance analysis, PTM site analysis, kinase inference, and network construction.
All analyses are tailored to your mass spectrometry platform, acquisition mode, quantification strategy, experimental design, and biological or clinical research objectives.
1. Mass Spectrometry Data Processing & Protein Quantification MaxQuant · DIA-NN · FragPipe · TMT · LFQ · SILAC
Rigorous raw mass spectrometry data processing — from spectrum-to-peptide matching and protein inference through missing value handling and quantification normalisation — is the essential foundation of every downstream proteomics analysis. We apply validated, platform-appropriate pipelines for all major mass spectrometry instruments and quantification strategies.
- Database search and peptide identification — MaxQuant, Proteome Discoverer, and FragPipe-based database searching against UniProt/SwissProt reference proteomes; semi-tryptic and non-specific digestion search options; variable and fixed modification searches; peptide and protein-level FDR control at 1% using target-decoy approach; match between runs (MBR) for improved quantification completeness
- Label-free quantification (LFQ) — MaxQuant LFQ intensity and iBAQ-based protein abundance estimation; intensity-based absolute quantification; protein copy number estimation; missing value imputation strategies (MinProb, KNN, BPCA) with sensitivity analysis
- TMT and iTRAQ multiplexed quantification — TMT reporter ion quantification with isotope correction; ratio compression assessment and SPS MS3 correction; batch effect assessment and correction across TMT multiplexed sets; TMTPro 16-plex and 18-plex support
- DIA proteomics analysis — DIA-NN and Spectronaut-based spectral library search and library-free direct-DIA analysis; chromatogram library generation with Skyline; protein and peptide quantification with q-value filtering; cross-run normalisation and interference scoring
2. Differential Abundance Analysis & Statistical Proteomics DEqMS · limma · Perseus · Volcano · Heatmap
Identifying proteins and phosphosites that change significantly between biological conditions requires statistical approaches specifically designed for the characteristics of mass spectrometry proteomics data — including the non-normal abundance distributions, pervasive missing values, high dimensionality, and heteroscedasticity that distinguish proteomics from RNA-seq and other count-based technologies.
- Proteomics-appropriate differential abundance testing — DEqMS variance-stabilised differential abundance testing accounting for peptide count-dependent variance; limma-based moderated t-tests with empirical Bayes variance sharing; MSstats and MSstatsTMT for complex experimental designs; Perseus statistical framework for large-scale proteomics datasets
- Missing value handling and normalisation — MNAR (missing not at random) vs. MCAR (missing completely at random) missing value classification; appropriate imputation strategies per missing value mechanism; median, quantile, VSN, and cyclic loess normalisation; normalisation method comparison and selection guidance
- Multiple testing correction and effect size estimation — Benjamini-Hochberg FDR correction; S-value and minimum effect size specification for biological relevance thresholding; volcano plot visualisation with FDR and fold-change thresholds; sample size and power estimation for proteomics experimental design
- Protein set enrichment and pathway analysis — Gene ontology (GO), KEGG, and Reactome pathway enrichment with clusterProfiler and fgsea; GSEA pre-ranked analysis on protein abundance log fold-changes; protein complex enrichment using CORUM database; tissue and cell-type expression atlas cross-reference
3. Phosphoproteomics & PTM Site Analysis PhosphoSitePlus · Kinase Inference · KSEA · Site Localisation
Phosphoproteomics maps the activation state of signalling networks at the level of individual phosphorylation sites — revealing which kinases are active, which substrates they phosphorylate, and how signalling is rewired by disease, drug treatment, or genetic perturbation. We provide comprehensive phosphoproteomics bioinformatics from phosphopeptide identification through kinase activity inference and signalling network reconstruction.
- Phosphopeptide identification and site localisation — MaxQuant and Proteome Discoverer phospho-enriched dataset analysis; phosphoRS and AScore-based phosphorylation site localisation probability scoring; class I (≥0.75 localisation probability) site filtering; multi-phosphopeptide ambiguity resolution; serine, threonine, and tyrosine site-level quantification matrices
- Kinase-substrate enrichment analysis (KSEA) — PhosphoSitePlus and NetworKIN-based kinase-substrate assignment; KSEA App and custom R-based kinase activity scoring from substrate site regulation; kinase activity heatmap generation across conditions and timepoints; kinase activity comparison between drug-sensitive and -resistant states
- Kinase activity inference with machine learning — VIPER and decoupleR-based transcription factor and kinase regulon activity scoring from phosphoproteomics data; CARNIVAL signalling network activity inference; PhosphoProteomics Toolbox-based upstream regulator identification
- PTM crosstalk and modification site integration — Multi-PTM dataset integration combining phosphorylation, ubiquitination (diGly), acetylation, and methylation sites; PTM crosstalk analysis identifying co-regulated modification sites on the same protein; modification site conservation and functional annotation from PhosphoSitePlus, UniMod, and PhosphoELM
4. Protein Interaction Networks & Interactome Analysis STRING · BioID · AP-MS · Cytoscape · Network Medicine
Proteins function through their interactions — and mapping the protein-protein interaction network of a biological system reveals the functional architecture that connects molecular events to cellular phenotypes. We provide specialist bioinformatics for all major interactome profiling approaches, from affinity purification mass spectrometry and proximity labelling through co-fractionation and cross-linking mass spectrometry.
- Affinity purification mass spectrometry (AP-MS) analysis — SAINT and MiST-based probabilistic scoring of specific interactors against IgG and control bait backgrounds; CompPASS-based interaction specificity scoring; Bait-Prey interaction matrix visualisation; cross-study interactome comparison and consensus network construction
- Proximity labelling interactome analysis — BioID, TurboID, and APEX2 dataset analysis with appropriate background correction; volcano plot-based specific interactor identification; spatial proteomics interpretation of proximity labelling data from subcellular compartment baits; temporal BioID pulse-labelling interactome dynamics
- Protein interaction network construction and analysis — STRING, BioGRID, and IntAct-augmented network construction from experimental interactome data; Cytoscape-based network visualisation; hub protein and bottleneck identification; network module and community detection; disease protein network module mapping and drug target identification
- Co-fractionation and cross-linking MS — SECAT and CCprofiler-based protein complex detection from co-fractionation mass spectrometry (CF-MS) data; pLink2 and xiSearch-based cross-link identification from chemical cross-linking mass spectrometry (XL-MS); structural constraint generation for AlphaFold-Multimer complex modelling
5. Clinical Proteomics, Drug Target Engagement & Multi-Omics Integration Plasma Biomarkers · TPP · Olink · Proteogenomics
Clinical proteomics bridges the gap between basic protein biology and translational medicine — enabling plasma biomarker discovery, drug target engagement validation, and multi-omics integration that connects genomic variation to protein-level phenotype. We provide specialist bioinformatics for clinical mass spectrometry proteomics, affinity proteomics platforms, thermal proteome profiling, and proteogenomic multi-omics integration.
- Clinical plasma and tissue proteomics — MaxQuant, DIA-NN, and Spectronaut-based analysis of clinical cohort plasma and tissue proteomics datasets; DEqMS differential abundance analysis between patient groups; ROC curve biomarker performance assessment; Olink proximity extension assay (PEA) NPX data normalisation and differential analysis; circulating protein biomarker panel development
- Thermal proteome profiling (TPP) and drug target identification — TP-Fold and NPARC-based TPP curve fitting and meltome shift analysis; drug target identification from compound-induced thermal stability changes; cellular thermal shift assay (CETSA) data analysis; multi-compound TPP comparison for selectivity profiling; proteome-wide target engagement scoring
- Proteogenomics analysis — Integration of somatic mutation and copy number data with protein abundance; variant peptide identification from personalised proteogenomic databases; pQTL analysis linking germline variants to protein abundance; protein abundance-transcript correlation analysis; post-transcriptional regulation identification from discordant mRNA-protein pairs
- Multi-omics proteomics integration — MOFA+ and mixOmics-based integration of proteomics with transcriptomics, phosphoproteomics, and metabolomics; weighted gene co-expression network analysis (WGCNA) adapted for proteomics; joint dimensionality reduction and sample clustering from multi-omics data; causal inference from proteomics-transcriptomics integration
Key Applications
Proteomics and phosphoproteomics bioinformatics across cancer biology, drug discovery, clinical research, and cell biology.
- Kinase signalling network mapping in cancer and drug resistance
- Drug target engagement validation from thermal proteome profiling
- Plasma and tissue proteomics biomarker discovery for clinical diagnostics
- CAR-T and immunotherapy response phosphoproteomic profiling
- Protein-protein interaction network mapping and hub target identification
- Proximity labelling interactome characterisation for organelle and complex biology
- Proteogenomic integration of somatic mutations and protein abundance in tumours
- PTM crosstalk and ubiquitin-proteasome pathway analysis
Tools, Technologies & Reference Databases
Validated, widely adopted proteomics bioinformatics tools and all major protein reference resources.
- Data Processing: MaxQuant, DIA-NN, Spectronaut, FragPipe, Proteome Discoverer, Skyline
- Statistical Analysis: DEqMS, limma, MSstats, Perseus, MSstatsTMT, iq (R)
- Phosphoproteomics: PhosphoRS, AScore, KSEA App, NetworKIN, decoupleR, VIPER
- Interactomics: SAINT, MiST, CompPASS, CCprofiler, pLink2, Cytoscape
- Multi-Omics: MOFA+, mixOmics, WGCNA, CARNIVAL, OmicsIntegrator
- UniProt / SwissProt — Reference protein sequence and functional annotation database for database searching and protein annotation
- PhosphoSitePlus — Curated phosphorylation, ubiquitination, acetylation, and methylation site database for PTM annotation and kinase-substrate mapping
- STRING / BioGRID / IntAct — Protein interaction reference databases for network construction and interactome context
- CORUM — Curated mammalian protein complex database for complex-level enrichment analysis
- Reactome / KEGG / PhosphoELM — Pathway and signalling databases for enrichment analysis and kinase-substrate annotation
Project Deliverables
Structured, publication-ready proteomics and phosphoproteomics bioinformatics outputs for every project.
- Protein and peptide identification and quantification tables with FDR-controlled results
- Differential abundance results with effect sizes, adjusted p-values, and volcano plots
- Pathway and GO term enrichment results with significance scores and network visualisations
- Phosphosite localisation table with class I site assignments and quantification
- Kinase activity scores and heatmaps across conditions and timepoints
- Protein interaction network figures with hub protein annotations
- Publication-ready figures (PDF/SVG/PNG at 300 dpi): volcano plots, heatmaps, network diagrams, PCA plots
- Full written scientific report with methods, results, biological interpretation, and recommendations
- Pipeline scripts and configuration files for complete analytical reproducibility
- Thermal proteome profiling meltome analysis and drug target engagement report
- Proximity labelling interactome SAINT scoring and network construction
- Proteogenomic variant peptide database construction and pQTL analysis
- Multi-omics MOFA+ integration with transcriptomics and metabolomics
- Clinical plasma biomarker panel ROC analysis and cross-cohort validation
- Manuscript methods section and supplementary figure legends
- Grant application proteomics bioinformatics sections and preliminary data
- Long-term retainer for ongoing proteomics programme analytical support
Frequently Asked Questions
Common questions from cancer biologists, pharmaceutical teams, and clinical proteomics researchers.
Data-dependent acquisition (DDA) selects the most abundant precursor ions for fragmentation in each MS cycle — providing deep identification of detected peptides but with stochastic sampling that leads to missing values across samples. Data-independent acquisition (DIA) fragments all precursor ions within defined isolation windows regardless of abundance — providing more complete, reproducible, and quantitatively accurate proteome coverage across samples at the cost of more complex spectra requiring spectral library deconvolution. For discovery experiments comparing many samples where quantification completeness is critical — such as clinical cohort proteomics or drug response profiling — DIA is generally preferred. For phosphoproteomics and PTM analysis where enrichment dramatically reduces sample complexity, DDA with phospho-enrichment remains highly effective. We advise on acquisition strategy at project scoping based on your instrument, sample type, and biological objectives.
Missing values are endemic to mass spectrometry proteomics and require careful handling — because the mechanism of missingness (missing at random vs. missing not at random due to low abundance) determines the appropriate statistical treatment. We classify missing values per protein and condition using the distribution of observed intensities, apply MNAR-appropriate imputation (left-censored minimum probability imputation) for proteins below the detection limit, and MCAR-appropriate imputation (KNN, BPCA) for randomly missing values. We always perform sensitivity analysis comparing results with and without imputation, and use DEqMS for differential testing — which explicitly models the relationship between peptide count and variance to account for the heteroscedasticity introduced by missing value imputation.
Yes. Kinase activity inference from phosphoproteomics data uses the principle that an active kinase phosphorylates its known substrate sites — so enrichment of phosphorylation on known substrates of a given kinase relative to a control condition indicates elevated kinase activity, even when the kinase itself is not detected or its abundance is unchanged. We apply kinase-substrate enrichment analysis (KSEA) using PhosphoSitePlus and NetworKIN kinase-substrate annotations, decoupleR and VIPER regulon-based kinase activity scoring, and CARNIVAL for upstream signalling network activity inference. These approaches provide kinase activity scores for dozens of kinases simultaneously from a single phosphoproteomics experiment.
Yes. Proximity labelling interactome datasets require specific statistical approaches to distinguish specific interactors from the high background of non-specifically biotinylated abundant cellular proteins. We use SAINT (Significance Analysis of INTeractome) and MiST scoring against matched control conditions (unfused BirA*, empty vector, or scrambled bait), and CompPASS-based scoring for datasets with multiple bait proteins. We construct bait-prey interaction networks, compare interactomes across conditions or genetic backgrounds, and integrate proximity labelling data with AP-MS and STRING reference interactome data for comprehensive protein interaction network construction.
Absolutely. We assist with the proteomics bioinformatics sections of grant applications — including proposed mass spectrometry data processing workflows, differential abundance statistical methodology, phosphoproteomics kinase inference approaches, interactome analysis plans, and preliminary proteomics data. Please contact us as early as possible in the grant preparation process to allow time for any preliminary analyses that would strengthen the scientific case.
Related Research Areas & Services
Proteomics and phosphoproteomics bioinformatics connects to multiple complementary services we support.
- Drug Development & AI-Driven Discovery — Proteomic target engagement validation, TPP-based drug target identification, ADMET proteomic biomarker development, and multi-omics patient stratification for pharmaceutical programmes
- Biomarker Discovery & Validation — Clinical plasma and tissue proteomics biomarker discovery, ROC analysis, cross-cohort validation, and companion diagnostic development complementing genomic biomarker programmes
- Cancer & Oncogenomics — Proteogenomic integration of somatic mutations with protein abundance, tumour proteome characterisation, and signalling network mapping in oncology
- AlphaFold & Structural Bioinformatics — Structural interpretation of protein interaction interfaces from XL-MS cross-linking data, AlphaFold-Multimer complex modelling informed by proximity labelling interactome data
- AI Drug Target Identification — Proteomic and pQTL evidence integration into multi-omics AI target prioritisation; protein network-based target identification and druggability assessment
- Custom Software & Pipeline Development — Bespoke proteomics analysis platforms, automated DIA quantification pipelines, and interactive protein network visualisation tools for internal research teams
Ready to Advance Your Proteomics or Phosphoproteomics Research?
Tell us about your mass spectrometry platform, your acquisition strategy, your experimental design, and your biological or clinical research objectives. Our proteomics and phosphoproteomics bioinformatics team will design a tailored analytical plan — typically within 48 hours of your enquiry. Whether you need quantitative proteomics differential analysis, phosphoproteomics kinase activity inference, protein interaction network construction, thermal proteome profiling analysis, clinical biomarker discovery, or multi-omics proteogenomic integration, we are here to deliver expert, publication-ready proteomics results from day one.