Spatial transcriptomics preserves what single-cell RNA sequencing discards — the anatomical context of gene expression. By measuring transcriptomes at defined positions within intact tissue sections, spatial transcriptomics reveals how tumour cell states, immune infiltrates, stromal architecture, and intercellular signalling programmes are organised in physical space. From mapping immune exclusion zones and tertiary lymphoid structures in solid tumours to characterising invasive tumour margins, hypoxic cores, and therapy-remodelled tissue architectures, spatial transcriptomics has become an indispensable tool in translational oncology and tissue biology. At BioinformaticsNext, we provide specialist spatial transcriptomics bioinformatics services — delivering expert tumour spatial mapping, tissue architecture analysis, and spatially-resolved multi-omics integration for cancer research, drug discovery, and clinical biomarker programmes.
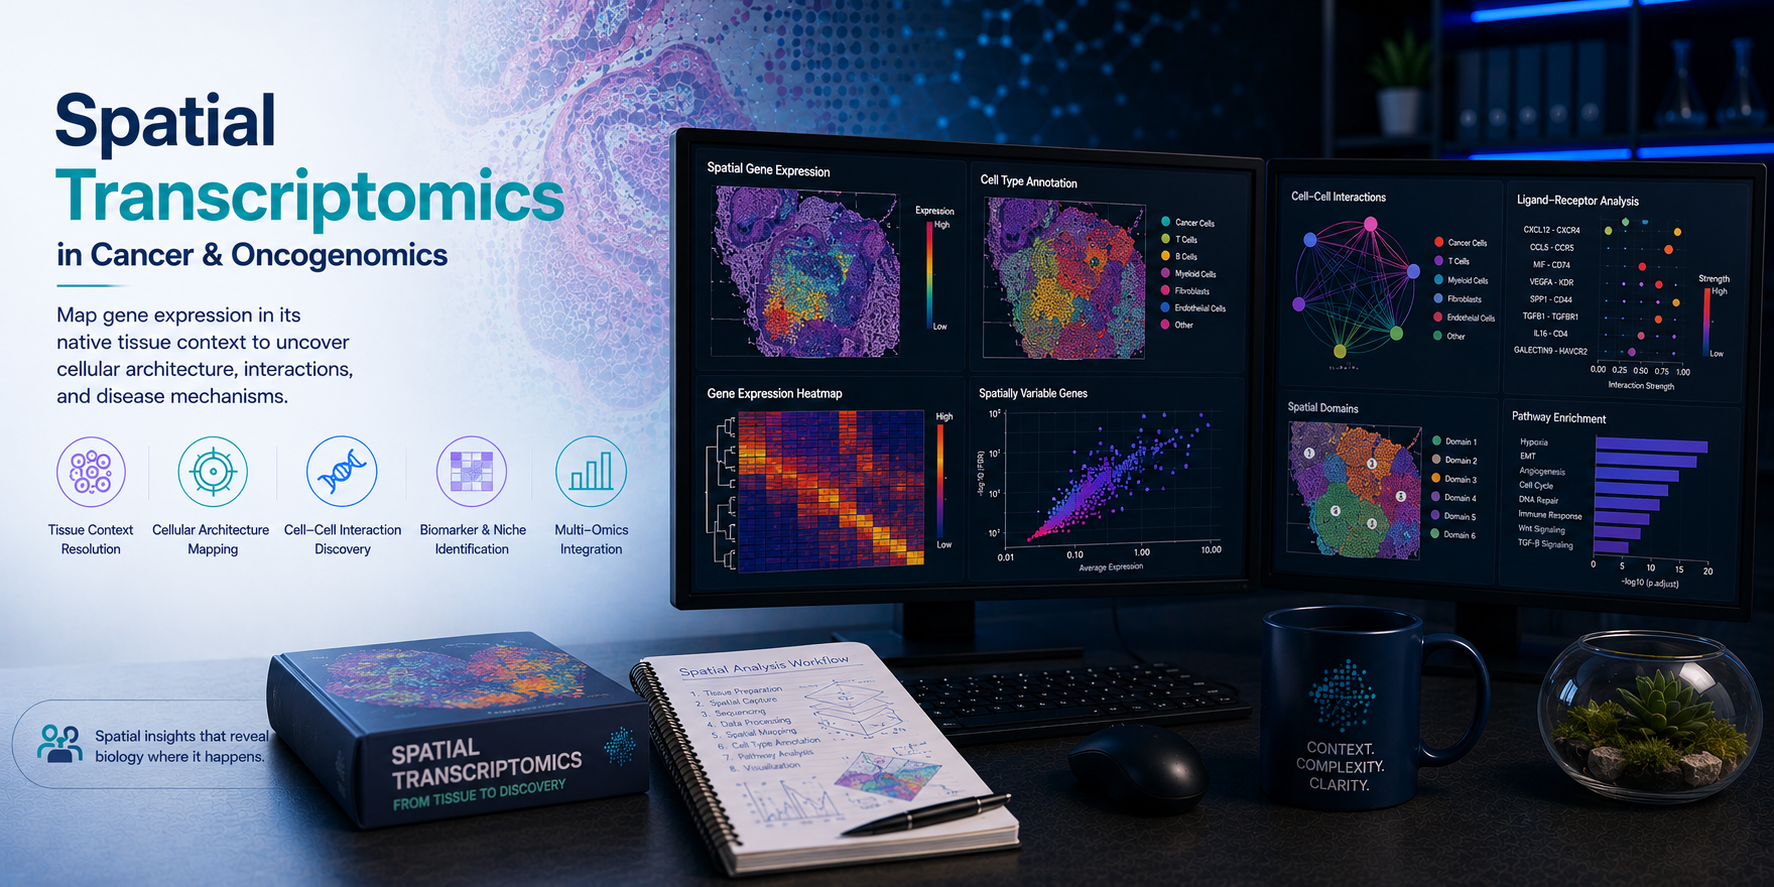
Spatial Transcriptomics Bioinformatics: Tumour Spatial Mapping & Tissue Architecture Analysis
Expert spatial transcriptomics analysis for tumour microenvironment spatial mapping, tissue architecture characterisation, cell type deconvolution, and spatially-resolved gene expression profiling across Visium, Xenium, MERSCOPE, CosMx, and Slide-seq platforms.
The tumour microenvironment is not a random mixture of cell types — it is an organised, spatially structured ecosystem in which the physical proximity of immune cells to tumour cells, the localisation of immunosuppressive niches, and the spatial arrangement of stromal compartments fundamentally determine therapeutic response and patient outcome. Immune cells excluded from the tumour parenchyma cannot kill cancer cells regardless of their activation state. Tertiary lymphoid structures form in specific anatomical locations and predict immunotherapy benefit. Hypoxic tumour cores drive metabolic reprogramming and therapy resistance. None of these spatially-encoded biological realities are accessible from dissociated single-cell or bulk RNA-seq data alone. At BioinformaticsNext, we provide the full spatial transcriptomics bioinformatics stack — from platform-specific data processing and quality control through to spatial domain identification, cell type deconvolution, ligand-receptor niche analysis, and integration with matched scRNA-seq and histological data.
What We Support
Comprehensive spatial transcriptomics bioinformatics across all major platforms, tissue types, and oncology and tissue biology applications.
- Visium, Visium HD, and CytAssist spatial transcriptomics data processing and analysis
- Xenium, MERSCOPE, CosMx, and Slide-seq single-molecule spatial data analysis
- Spatially variable gene expression identification and spatial domain segmentation
- Cell type deconvolution of spatial spots using matched or reference scRNA-seq signatures
- Tumour microenvironment spatial mapping: immune exclusion, invasion fronts, and TLS identification
- Spatial cell-cell communication and ligand-receptor niche interaction analysis
- Tissue architecture characterisation and pathological region annotation
- Integration of spatial transcriptomics with H&E histology, IHC, and single-cell data
- Multi-section and multi-patient cohort spatial analysis and cross-sample comparison
- Spatial biomarker discovery for clinical trial stratification and companion diagnostics
Our Spatial Transcriptomics Bioinformatics Services
Specialist spatial transcriptomics analysis across platform-specific processing, spatial domain identification, cell type mapping, TME architecture, and multi-omics integration.
All analyses are tailored to your spatial platform, tissue type, tumour indication, experimental design, and translational or research objectives.
1. Platform-Specific Data Processing & Quality Control Visium · Visium HD · CytAssist · SpaceRanger · QC
Each spatial transcriptomics platform has distinct data structures, technical artefacts, and quality considerations that require platform-appropriate processing and QC before any biological analysis begins. We apply validated, platform-specific pipelines across all major spatial sequencing and imaging-based transcriptomics technologies.
- Visium and Visium HD processing — SpaceRanger alignment to reference genome (GRCh38, GRCm39); tissue detection and spot barcode filtering; UMI count matrix generation; per-spot QC metrics (genes detected, UMI count, mitochondrial fraction); low-quality spot flagging and removal; Visium HD binning strategy selection (2 µm, 8 µm, 16 µm bins)
- Single-molecule FISH platform processing — Xenium Explorer and Baysor-based transcript segmentation and cell boundary assignment from Xenium data; Vizgen MERSCOPE and NanoString CosMx transcript count extraction; cell segmentation quality assessment and transcript assignment confidence filtering
- Slide-seq and HDST processing — Puck-based spatial barcode alignment; read-to-bead assignment and UMI deduplication; spatial coordinate registration and bead quality filtering for high-resolution Slide-seq V2 and HDST datasets
- Normalisation and batch correction — SCTransform and scran-based normalisation of spatially-resolved count matrices; section-to-section batch correction for multi-section cohort analysis; library size and tissue composition-aware normalisation strategies
2. Spatial Domain Identification & Tissue Architecture Analysis BayesSpace · BANKSY · SpatialDE · Tissue Segmentation
Spatial domain identification partitions tissue sections into transcriptomically and spatially coherent regions — capturing tumour core, invasive margin, immune infiltrated stroma, necrotic zones, and normal adjacent tissue as distinct analytical compartments that can be compared and characterised independently.
- Unsupervised spatial clustering and domain identification — BayesSpace, BANKSY, and STAGATE-based spatially-aware clustering that incorporates both transcriptional similarity and physical proximity; optimal cluster number selection; spatial domain boundary visualisation overlaid on H&E histology images
- Spatially variable gene expression — SpatialDE, SPARK-X, and nnSVG-based identification of genes with statistically significant spatial expression patterns; spatial autocorrelation analysis; identification of genes marking specific tissue regions, tumour niches, or stromal compartments
- Histology-guided region annotation — Co-registration of spatial transcriptomics data with H&E histology and IHC images; pathologist annotation integration for tumour, stroma, necrosis, and immune infiltrate region labelling; transcriptomic validation of histologically defined regions
- Tissue architecture comparison across samples — Spatial domain composition comparison between patients, treatment conditions, and disease stages; identification of tissue architecture features associated with clinical response, recurrence, and survival
3. Cell Type Deconvolution & TME Spatial Mapping cell2location · RCTD · SPOTlight · Immune Mapping
Visium spots (55 µm) typically contain multiple cells — making cell type deconvolution essential to translate spatial gene expression patterns into spatially-resolved cell type composition maps. We apply state-of-the-art deconvolution methods using matched or reference single-cell RNA-seq signatures to generate high-resolution spatial maps of all major tumour, immune, and stromal cell populations.
- Multi-cell spot deconvolution — cell2location, RCTD, and SPOTlight Bayesian deconvolution of Visium spots into constituent cell types using matched or reference scRNA-seq cell type signatures; cell type abundance mapping across tissue sections; confidence interval estimation for deconvolution outputs
- Tumour immune microenvironment spatial composition — Spatial mapping of CD8+ cytotoxic T cells, CD4+ helper and regulatory T cells, tumour-associated macrophages (TAMs), NK cells, B cells, dendritic cells, and cancer-associated fibroblasts (CAFs) across tumour tissue sections; quantification of immune cell density within tumour core vs. invasive margin vs. excluded stroma
- Immune exclusion and desert phenotype mapping — Spatial classification of tumour sections into immune inflamed, excluded, and desert phenotypes from deconvolution-derived immune density maps; identification of physical barriers (desmoplastic stroma, CAF layers) associated with immune exclusion; correlation with clinical immunotherapy response
- Tertiary lymphoid structure (TLS) identification — TLS gene signature scoring and spatial localisation; B cell follicle and T cell zone spatial co-localisation; mature TLS vs. immature TLS classification; TLS density and proximity to tumour parenchyma as prognostic spatial biomarkers
4. Spatial Cell-Cell Communication & Niche Analysis CellChat · NicheNet · COMMOT · Spatial Niches
Intercellular signalling in the tumour microenvironment is fundamentally spatial — paracrine signals are distance-limited, and the formation of immunosuppressive or pro-tumorigenic niches depends on the physical co-localisation of specific cell types. Spatially-resolved ligand-receptor interaction analysis reveals the active signalling circuits operating within specific tissue niches that cannot be inferred from dissociated single-cell data.
- Spatially-resolved ligand-receptor analysis — COMMOT, SpatialDM, and CellChat spatial-mode ligand-receptor interaction analysis incorporating physical distance constraints; identification of active signalling interactions between co-localised cell populations; comparison of spatial signalling networks between tumour regions and treatment conditions
- Immunosuppressive niche characterisation — Spatial co-localisation analysis of Treg, TAM, and tumour cell populations driving local immunosuppression; TGF-β, VEGF, IL-10, and PD-L1/PD-1 signalling spatial mapping; identification of immunosuppressive hotspots as potential drug target niches
- Tumour invasion front and border analysis — Spatial profiling of the tumour-stroma interface; CAF activation and ECM remodelling gene expression mapping at invasion borders; spatial enrichment of EMT programme along invasion fronts; immune cell exclusion mechanisms at tumour boundaries
- Hypoxia and metabolic niche mapping — Spatial mapping of hypoxia gene signatures (HIF1A targets, VEGF, LDHA); metabolic heterogeneity across tumour spatial domains; co-localisation of hypoxic tumour cells with immunosuppressive TAM populations and necrotic core boundaries
5. Multi-Platform Integration & Spatial Biomarker Discovery scRNA-seq · H&E · IHC · Clinical Outcomes · CDx
The full analytical power of spatial transcriptomics is realised when it is integrated with matched single-cell data, histological annotations, proteomic measurements, and clinical outcome information — enabling spatially-resolved biomarker discovery with direct translational applicability to patient stratification and companion diagnostic development.
- scRNA-seq and spatial data co-analysis — Seurat and Squidpy-based joint analysis of matched spatial and single-cell datasets; label transfer from high-resolution scRNA-seq cell type annotations to spatial spots; validation of scRNA-seq-derived cell state signatures in spatial context; identification of spatially-restricted cell states missed by dissociated scRNA-seq
- H&E and IHC image integration — Deep learning-based H&E tissue segmentation with StarDist and Cellpose; automated tumour region, necrosis, and immune infiltrate annotation; spatial co-registration of IHC protein staining with transcriptomic data for multi-modal biomarker validation
- Multi-section cohort spatial analysis — Batch-corrected integration of spatial transcriptomics data from multiple patients and tissue sections; spatial domain composition comparison across clinical groups (responder vs. non-responder, primary vs. metastatic, pre- vs. post-treatment); statistical testing of spatial feature differences with appropriate mixed-effects models
- Spatial biomarker discovery and clinical correlation — Machine learning models trained on spatially-derived features for clinical outcome prediction; immune exclusion score, TLS density, and spatial gene signature development as candidate companion diagnostic biomarkers; correlation of spatial TME features with progression-free and overall survival
Key Applications
Spatial transcriptomics bioinformatics across oncology, tissue biology, and translational medicine.
- Immune checkpoint inhibitor response TME spatial profiling
- Tumour immune exclusion zone mapping and barrier identification
- Tertiary lymphoid structure detection and prognostic scoring
- Therapy-induced TME remodelling in pre- and post-treatment biopsies
- Tumour invasion front and EMT spatial programme characterisation
- Spatial biomarker discovery for immunotherapy patient stratification
- Brain, liver, lung, breast, colorectal, and pancreatic tumour architecture mapping
- FFPE archival tumour cohort spatial transcriptomics analysis
Tools, Technologies & Reference Resources
Validated, cutting-edge spatial transcriptomics bioinformatics tools across all major platforms and analysis workflows.
- Processing: SpaceRanger, Baysor, Xenium Explorer, FICTURE, Pcitools
- Analysis: Seurat (spatial), Squidpy, Giotto, SpatialExperiment (R), STUtility
- Spatial Clustering: BayesSpace, BANKSY, STAGATE, GraphST, PRECAST
- Spatially Variable Genes: SpatialDE, SPARK-X, nnSVG, NNSVG
- Deconvolution: cell2location, RCTD, SPOTlight, Tangram, DestVI, BayesPrism
- Cell Communication: COMMOT, SpatialDM, CellChat (spatial), NicheNet
- Image Analysis: StarDist, Cellpose, QuPath, ImageJ/FIJI, deepcell
- Multi-omics Integration: Seurat WNN, MOFA+, MISTy, SpatialGlue
- TISCH2 / Human Cell Atlas — Single-cell reference atlases for spatial deconvolution signature generation
- MSigDB / CancerSEA / pan-cancer atlases — Gene signatures for spatial cell state scoring and pathway mapping
Project Deliverables
Structured, publication-ready spatial transcriptomics bioinformatics outputs for every project.
- Processed spatial data object (SpatialExperiment/AnnData) with QC metrics and spot annotations
- Spatial cluster maps overlaid on H&E histology images with domain annotation
- Spatially variable gene lists with statistical scores and spatial expression visualisations
- Cell type deconvolution abundance maps for all major tumour, immune, and stromal populations
- TME spatial composition summary: immune density, exclusion score, and TLS identification
- Ligand-receptor spatial interaction network figures and niche analysis tables
- Spatial biomarker candidate list with clinical correlation statistics (where applicable)
- Publication-ready figures (PDF/SVG/PNG at 300 dpi): spatial maps, violin plots, dot plots
- Full written scientific report with methods, results, and translational interpretation
- Integration with matched scRNA-seq data for label transfer and validation
- Deep learning H&E image segmentation and IHC co-registration
- Multi-patient cohort spatial analysis with clinical outcome correlation
- Spatial biomarker machine learning model development for CDx applications
- Manuscript methods section and supplementary figure legends
- Grant application spatial transcriptomics sections and preliminary data
- Long-term retainer for ongoing cohort expansion and biomarker validation
Frequently Asked Questions
Common questions from oncology researchers, translational teams, and pharmaceutical spatial biology programmes.
Platform choice depends on your research question, tissue availability, and resolution requirements. Visium HD (2 µm resolution) is ideal for FFPE archival cohorts requiring genome-wide transcriptome profiling across large tissue areas. Xenium and MERSCOPE offer single-cell resolution for a defined gene panel — ideal when specific cell types or pathways are the focus and cellular-level spatial precision is critical. CosMx offers the largest validated gene panel among single-molecule platforms. We discuss platform trade-offs, panel design, and experimental design at project scoping to ensure the most appropriate platform is selected for your specific biological question.
Yes. Visium CytAssist and Visium HD are specifically optimised for FFPE tissue — enabling spatially-resolved transcriptomics from archival tumour blocks collected during clinical care or stored from clinical trials. Xenium and CosMx also support FFPE tissue with appropriate probe-based detection chemistry. FFPE spatial transcriptomics requires specific RNA quality assessment and optimised protocols, but enables access to large, clinically annotated cohorts with long-term outcome data that are not available from fresh or frozen tissue alone.
Matched scRNA-seq is ideal but not always required. If matched single-cell data from the same tissue type and disease context is available, it provides the most accurate cell type signatures for deconvolution. However, we can also use published reference atlases — such as the Human Cell Atlas, TISCH2 pan-cancer single-cell atlas, or disease-specific published datasets — as deconvolution references when matched data is unavailable. We assess reference dataset appropriateness and report deconvolution confidence metrics transparently for every project.
Multi-section and multi-patient spatial analysis requires careful batch correction, normalisation, and statistical framework design. We apply section-to-section batch correction, spatially-aware normalisation, and mixed-effects regression models that account for patient-level random effects when comparing spatial features across clinical groups. Spatial domain composition and biomarker features are summarised at the patient level for statistical testing — ensuring that biological replication rather than technical spot-level pseudoreplication drives the analysis.
Absolutely. We assist with the spatial transcriptomics bioinformatics sections of grant applications — including proposed analysis workflows, platform selection rationale, deconvolution and niche analysis methodology, and preliminary spatial data. Please contact us as early as possible in the grant preparation process to allow time for any preliminary spatial analyses needed to strengthen the application.
Related Research Areas & Services
Spatial transcriptomics bioinformatics connects to multiple complementary services we support.
- Single-Cell RNA-seq: TME & Clonal Evolution — Matched scRNA-seq analysis providing cell type signatures for spatial deconvolution, clonotype-phenotype integration, and single-cell-level TME profiling to complement spatial data
- Cancer & Oncogenomics — Somatic variant calling, mutational signature analysis, and WGS-based clonal evolution for integration with spatial transcriptomics tumour profiling
- Immunology & Immuno-Oncology — Immune cell biology, checkpoint pathway analysis, and neoantigen identification to complement spatially-resolved TME immune mapping
- Cell & Gene Therapy Bioinformatics — Spatial profiling of gene therapy target tissues and CAR-T infiltration mapping in solid tumour biopsy sections
- Neurogenomics & Brain Organoid Bioinformatics — Spatial transcriptomics of brain tissue sections for anatomical region mapping, cortical layer analysis, and neurodegeneration-associated spatial gene expression profiling
- Custom Software & Pipeline Development — Bespoke spatial transcriptomics analysis platforms, interactive tissue atlas explorers, and automated spatial biomarker reporting pipelines for internal research and clinical teams
Ready to Map the Spatial Architecture of Your Tumour Data?
Tell us about your spatial transcriptomics platform, your tissue type, and your research or translational objectives. Our spatial transcriptomics bioinformatics team will design a tailored analytical plan — typically within 48 hours of your enquiry. Whether you need tumour immune exclusion mapping, TLS identification, spatially-resolved TME niche analysis, FFPE cohort spatial profiling, or spatial biomarker discovery for a clinical trial, we are here to deliver expert, publication-ready spatial results from day one.