Metabolomics — the comprehensive profiling of small molecule metabolites in biological samples — provides the most direct molecular readout of cellular biochemical activity, capturing the integrated output of gene expression, protein function, and environmental influence in a single analytical window. From untargeted LC-MS and GC-MS metabolomics for biomarker discovery and pathway analysis to targeted quantitative metabolite panels, lipidomics, and multi-omics metabolomics integration, metabolomics data analysis demands specialist bioinformatics expertise in mass spectrometry data processing, statistical analysis, metabolite identification, and biological pathway interpretation. At BioinformaticsNext, we provide expert metabolomics data analysis services — supporting cancer research, cardiovascular disease, diabetes, microbiome-metabolome interaction, drug discovery, and clinical biomarker programmes with rigorous, reproducible, and biologically interpretable metabolomics analysis.
Metabolomics Data Analysis: LC-MS, GC-MS, Lipidomics & Multi-Omics Integration
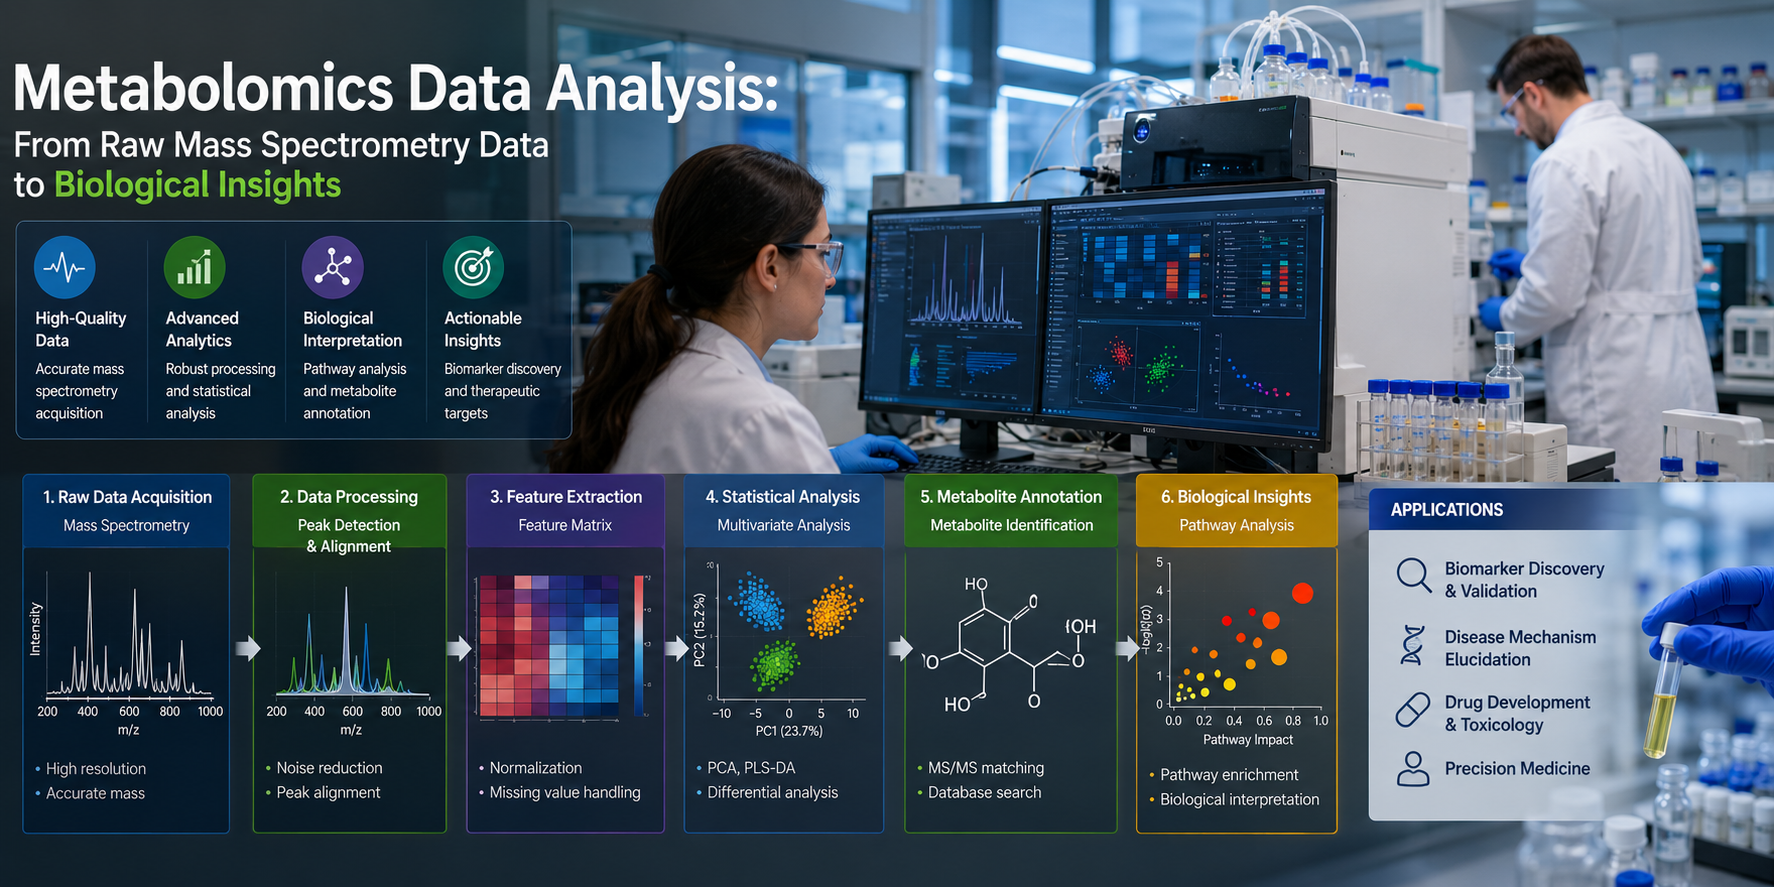
Expert bioinformatics for untargeted and targeted LC-MS and GC-MS metabolomics, lipidomics, NMR metabolomics, metabolite identification and annotation, differential metabolite analysis, pathway enrichment, and multi-omics metabolomics integration across clinical, pharmaceutical, and research applications.
The metabolome sits at the functional endpoint of the central dogma — representing the biochemical phenotype of a cell, tissue, or organism at a given moment in time. Metabolomics captures this phenotype comprehensively, providing information about energy metabolism, biosynthetic pathway activity, xenobiotic processing, oxidative stress, lipid remodelling, and nutrient sensing that is invisible to genomics and transcriptomics alone. Yet mass spectrometry-based metabolomics generates exceptionally complex data — thousands of ion features per sample, significant analytical variation within and between batches, incomplete metabolite databases for annotation, and the ever-present challenge of distinguishing true biological signal from technical noise. Expert bioinformatics is essential at every stage: from raw data processing and peak picking through statistical normalisation, differential abundance analysis, and metabolite identification to pathway analysis, multi-omics integration, and biomarker model development.
What We Support
Comprehensive metabolomics data analysis across all major platforms, acquisition modes, and biological applications.
- Untargeted LC-MS metabolomics: HILIC and reverse-phase positive and negative ion mode data processing
- GC-MS metabolomics: primary metabolism profiling, derivatisation artefact handling, and spectral matching
- Targeted quantitative metabolomics and stable isotope tracer analysis
- Lipidomics: lipid species identification, class-level quantification, and lipidome comparison
- NMR metabolomics: spectral deconvolution, metabolite quantification, and chemometric analysis
- Metabolite annotation and identification against HMDB, KEGG, LIPID MAPS, and MZmine databases
- Differential metabolite abundance analysis between clinical and experimental groups
- Metabolic pathway enrichment and over-representation analysis
- Biomarker discovery and metabolite panel development for clinical applications
- Multi-omics integration: metabolomics with transcriptomics, proteomics, and microbiome data
Our Metabolomics Data Analysis Services
Specialist metabolomics bioinformatics — from raw MS data processing and quality control through metabolite annotation, differential analysis, pathway enrichment, and multi-omics integration.
All analyses are tailored to your mass spectrometry platform, acquisition mode, sample type, biological question, and clinical or research reporting requirements.
1. LC-MS Data Processing & Feature Detection XCMS · MZmine · OpenMS · Feature Alignment · Peak Picking
Accurate and reproducible feature detection, alignment, and quality control are the foundation of every downstream metabolomics analysis. We apply validated, platform-appropriate LC-MS data processing pipelines with appropriate QC sample strategies, blank subtraction, and batch correction to ensure that biological signal is reliably distinguished from analytical variation.
- Raw data processing and peak picking — XCMS, MZmine3, and OpenMS-based centroiding, peak detection, and feature extraction from Thermo Orbitrap, Bruker QTOF, Waters Xevo, and Agilent QTOF instruments; XCMS centWave and matched filter peak picking parameter optimisation for HILIC and reverse-phase LC methods; MS2 spectral acquisition and fragmentation event association with precursor features
- Feature alignment and gap filling — Retention time correction and peak alignment across samples with XCMS obiwarp and MZmine join aligner; gap filling for features detected in some but not all samples; adduct annotation and isotope grouping with CAMERA and SIRIUS; feature redundancy reduction by adduct and in-source fragment deconvolution
- Quality control and batch correction — Pooled QC sample injection strategy analysis; coefficient of variation (CV) filtering at 20–30% threshold in QC samples; signal drift correction using QC sample-based cubic spline or LOESS regression; inter-batch correction with ComBat and QC-RLSC; principal component analysis of QC sample clustering for batch effect visualisation and assessment
- Blank subtraction and contaminant removal — Procedural blank and solvent blank signal subtraction; feature filtering by sample-to-blank intensity ratio (≥5–10 fold); common contaminant and plasticiser feature removal; matrix-specific background feature exclusion using reference compound libraries
2. GC-MS Metabolomics & Primary Metabolism Profiling AMDIS · MetaboAnalyst · Spectral Matching · NIST · Derivatisation
GC-MS metabolomics provides exceptional coverage of primary metabolites — amino acids, organic acids, sugars, fatty acids, and TCA cycle intermediates — with highly reproducible retention indices and fragmentation spectra that enable confident metabolite identification against reference spectral libraries. We apply validated GC-MS metabolomics workflows covering the full analytical pipeline from raw chromatogram processing through spectral matching and biological interpretation.
- GC-MS raw data processing — AMDIS and MZmine3-based GC-MS chromatogram deconvolution and peak detection; retention index (RI) calculation against alkane standard ladders; RI-guided spectral library matching; derivatisation artefact (TMS, MEOX) recognition and filtering; sample-to-sample RI alignment for robust cross-sample comparison
- Spectral library matching and metabolite identification — NIST23, Golm Metabolome Database (GMD), MassBank, and Fiehn GC-MS library spectral matching with combined RI and mass spectral similarity scoring; identification confidence level assignment per Sumner et al. MSI criteria (Levels 1–4); tentative annotation of unmatched features by compound class from fragmentation patterns
- Primary metabolite profiling and pathway coverage — Comprehensive coverage of TCA cycle intermediates, amino acid pools, sugar phosphates, organic acids, and polyols; isotopologue distribution analysis for 13C stable isotope tracer experiments; metabolic flux direction inference from tracer labelling patterns; comparison against reference tissue metabolite concentrations from public databases
- GC-MS data normalisation and statistical preparation — Total ion current (TIC) and internal standard-based normalisation; sample weight and protein content normalisation for tissue metabolomics; missing value imputation strategies for GC-MS data; log transformation and autoscaling for multivariate analysis preparation
3. Metabolite Annotation, Identification & Statistical Analysis HMDB · SIRIUS · MetaboAnalyst · mzML · MS2 · Differential
Metabolite annotation — assigning chemical identities to detected MS features — is the most analytically challenging step in untargeted metabolomics, requiring integration of accurate mass, isotope pattern, fragmentation spectra, retention time, and database information. We apply validated annotation workflows with explicit confidence level reporting, followed by rigorous differential abundance statistical analysis appropriate for the distributional characteristics of metabolomics data.
- Metabolite annotation and identification — Accurate mass-based formula prediction with Mzmine3 and SIRIUS; MS2 fragmentation spectral matching against HMDB, MassBank, GNPS, and mzCloud spectral libraries; SIRIUS+CSI:FingerID machine learning-based structure prediction from MS2 spectra; CANOPUS compound class prediction; identification confidence level reporting per MSI Levels 1–4; in silico fragmentation with CFM-ID and MetFrag for unannotated features
- Differential metabolite abundance analysis — limma, Welch t-test, and Wilcoxon rank-sum test for pairwise group comparisons; DESeq2-style negative binomial modelling for metabolomics count data; FDR correction with Benjamini-Hochberg procedure; effect size (fold change, Cohen's d) and volcano plot visualisation; multiple group comparisons with ANOVA and Kruskal-Wallis with post-hoc testing
- Normalisation and data transformation — Probabilistic quotient normalisation (PQN), total area normalisation, and internal standard normalisation strategy comparison; log2 transformation, generalised log, and variance stabilising normalisation (VSN); Pareto scaling and unit variance scaling for multivariate analysis; sample outlier detection and handling with robust PCA
- MetaboAnalyst-based statistical analysis — MetaboAnalyst 6.0 online and R package-based statistical analysis pipeline; ROC curve biomarker analysis; concentration heatmap and hierarchical clustering; time-series and one-factor statistical analysis; power analysis for metabolomics study design
4. Lipidomics & Lipid Class Analysis LipidSearch · LIPID MAPS · LipidAnnotator · Lipidome · Fatty Acids
Lipidomics — the comprehensive profiling of lipid species across all major lipid classes — provides critical biological insight into membrane composition, energy storage, lipid signalling, and inflammatory mediator biology. We provide specialist lipidomics bioinformatics covering all major lipid classes with appropriate platform-specific data processing and lipid species-level quantification.
- Lipidomics data processing and lipid identification — LipidSearch 5.0 and LipidAnnotator-based lipid species identification from Thermo and Bruker LC-MS/MS data; LIPID MAPS Structure Database (LMSD) and LipidBlast spectral library matching; lipid class, species, and molecular species level identification; fatty acid chain length and degree of unsaturation characterisation; ether lipid, lysolipid, and oxidised lipid annotation
- Lipid class and species quantification — Internal standard-based relative and absolute lipid quantification; class-level normalisation using class-specific internal standards; lipid species abundance matrix construction across biological samples; fatty acid saturation index and unsaturation index calculation; plasmalogen and ether-linked phospholipid quantification
- Differential lipidomics analysis — Lipid species-level differential abundance between disease and control groups; lipid class-level composition comparison; volcano plot and heatmap visualisation of altered lipid species; lipid network analysis using LipidNetworkExplorer; eicosanoid and oxylipid inflammatory mediator profiling
- Clinical lipidomics biomarker applications — Cardiovascular disease lipidomic risk biomarker discovery; ceramide, sphingomyelin, and lysophosphatidylcholine species as disease markers; lipid panel optimisation for clinical diagnostic application; correlation of lipidomic profiles with traditional clinical lipid measurements (LDL, HDL, triglycerides)
5. Pathway Analysis, Biomarker Development & Multi-Omics Integration KEGG · MetaboAnalyst · mummichog · MOFA+ · Microbiome
Translating a list of differentially abundant metabolites into biological insight requires pathway-level interpretation, and integrating metabolomics with transcriptomics, proteomics, and microbiome data reveals the mechanistic connections between molecular layers that no single omics approach can uncover alone. We provide comprehensive metabolomics pathway analysis, biomarker model development, and multi-omics integration for translational and systems biology applications.
- Metabolic pathway enrichment analysis — MetaboAnalyst pathway analysis and mummichog pathway enrichment for LC-MS data without prior metabolite identification; KEGG, Reactome, SMPDB, and BioCyc pathway over-representation analysis; pathway impact analysis combining enrichment and topology; MetaboAnalyst joint pathway analysis integrating metabolomics and transcriptomics pathway results
- Multivariate statistical analysis — Principal component analysis (PCA) for metabolomics sample clustering and quality assessment; partial least squares discriminant analysis (PLS-DA) and OPLS-DA for supervised classification; VIP (variable importance in projection) score-based feature selection; cross-validation and permutation testing for PLS-DA model validation; random forest and LASSO for metabolomics feature selection and biomarker panel development
- Metabolomics biomarker discovery and panel development — Individual metabolite ROC curve analysis with AUC and confidence interval estimation; multivariate metabolite panel logistic regression model development; LASSO and elastic net regularisation for sparse panel selection; cross-cohort validation of metabolite biomarker panels; metabolite panel clinical utility assessment with decision curve analysis
- Multi-omics metabolomics integration — MOFA+ multi-omics factor analysis integrating metabolomics with transcriptomics and proteomics; mmvec neural network-based microbiome-metabolome co-occurrence analysis; metabolite-gene correlation and mQTL mapping; Spearman and Pearson correlation network construction between metabolites and other omics features; joint KEGG pathway activity analysis across metabolomics and transcriptomics layers
Key Applications
Metabolomics data analysis across cancer, cardiovascular disease, diabetes, drug discovery, microbiome research, and clinical biomarker development.
- Tumour metabolic reprogramming: Warburg effect, TCA cycle, and one-carbon metabolism
- Plasma lipidomics biomarker discovery for cardiovascular disease risk stratification
- Gut microbiome-metabolome interaction: SCFA, bile acid, and tryptophan metabolism
- Drug metabolism and pharmacokinetic metabolite profiling in clinical samples
- Type 2 diabetes and insulin resistance plasma metabolomics signature development
- 13C stable isotope tracer metabolic flux analysis in cell culture and tissue
- Ageing metabolome characterisation: NAD+, tryptophan, and sphingolipid profiling
- Environmental exposure metabolomics and xenobiotic metabolite identification
Tools, Technologies & Reference Databases
Validated, widely adopted metabolomics bioinformatics tools and all major metabolite reference databases.
- LC-MS Processing: XCMS, MZmine3, OpenMS, MS-DIAL, MAVEN, Compound Discoverer
- GC-MS Processing: AMDIS, MZmine3, MetaboliteDetector, SpectConnect
- Annotation: SIRIUS+CSI:FingerID, CANOPUS, CFM-ID, MetFrag, mzCloud
- Lipidomics: LipidSearch 5.0, LipidAnnotator, LIQUID, LipidBlast, LipidMatch
- Statistical Analysis: MetaboAnalyst 6.0, ROCCET, mummichog, mixOmics, limma
- HMDB (Human Metabolome Database) — Comprehensive human metabolite structure, spectra, and biological role reference database for annotation and pathway analysis
- LIPID MAPS — Comprehensive lipid structure and classification database for lipidomics annotation and class-level analysis
- KEGG / Reactome / SMPDB — Metabolic pathway databases for enrichment analysis and pathway-level biological interpretation
- GNPS / MassBank / mzCloud — MS2 spectral reference libraries for metabolite identification by fragmentation matching
- MetaboLights / Metabolomics Workbench — Public metabolomics data repositories for cross-study validation and reference dataset access
Project Deliverables
Structured, publication-ready metabolomics data analysis outputs for every project.
- Feature table with m/z, retention time, intensity, and annotation confidence levels
- QC metrics report: CV distribution, batch effect assessment, and sample pass/fail
- Annotated metabolite list with identification confidence level, HMDB ID, and pathway membership
- Differential abundance results: fold change, p-value, FDR, and volcano plot per comparison
- Pathway enrichment results: over-represented pathways with impact and p-values
- PCA, PLS-DA, and hierarchical clustering visualisations
- Biomarker panel ROC curves and AUC performance metrics (biomarker projects)
- Publication-ready figures (PDF/SVG/PNG at 300 dpi)
- Full written scientific report with methods, results, and biological interpretation
- Stable isotope tracer analysis and 13C metabolic flux calculation
- Lipidomics species-level quantification and lipidome network analysis
- Microbiome-metabolome mmvec co-occurrence and SCFA/bile acid analysis
- Multi-omics MOFA+ integration with transcriptomics and proteomics
- MetaboLights or Metabolomics Workbench public database submission support
- Manuscript methods section and supplementary figure legends
- Grant application metabolomics bioinformatics sections and preliminary data
- Long-term retainer for ongoing metabolomics programme analytical support
Frequently Asked Questions
Common questions from metabolomics researchers, clinical biomarker teams, and pharmaceutical drug discovery groups.
Untargeted metabolomics profiles as many metabolites as possible in a sample without prior selection — using full-scan or data-dependent MS2 acquisition to detect thousands of ion features simultaneously. It is used for discovery applications where the metabolites of interest are not known in advance, but annotation remains challenging and quantification is relative rather than absolute. Targeted metabolomics measures a pre-defined panel of specific metabolites — typically using selected reaction monitoring (SRM/MRM) or parallel reaction monitoring (PRM) — providing high sensitivity, absolute quantification with stable isotope internal standards, and excellent reproducibility for validated metabolite panels. For biomarker discovery and biological pathway hypothesis generation, untargeted metabolomics is preferred; for clinical validation of specific metabolite markers and pharmacokinetic drug metabolite profiling, targeted approaches are appropriate. Many projects use a sequential strategy — untargeted discovery followed by targeted validation of the most promising candidates.
Metabolite annotation in untargeted LC-MS metabolomics is genuinely difficult — only a minority of detected features can be confidently identified. We report annotations at explicit confidence levels per the MSI (Metabolomics Standards Initiative) guidelines: Level 1 (confirmed by authentic standard co-elution and MS2 match), Level 2 (putatively annotated by spectral library MS2 match without authentic standard), Level 3 (putatively characterised by compound class from fragmentation pattern), and Level 4 (unknown). We use SIRIUS+CSI:FingerID for machine learning-based structural prediction from MS2 spectra, CANOPUS for compound class prediction, and mummichog for pathway enrichment that works directly from accurate m/z values without requiring prior metabolite identification. We are transparent about annotation uncertainty and never over-claim identification confidence levels in reporting.
Sample size requirements depend on expected metabolite effect sizes, biological and technical variation in your sample matrix, and the number of statistical comparisons planned. As a general guide, untargeted metabolomics studies comparing two groups require a minimum of 10–15 biological replicates per group for adequate statistical power at typical metabolomics effect sizes, with 20–30 per group preferred for more reliable differential abundance results. Smaller group sizes dramatically increase false discovery rates in high-dimensional metabolomics data. For biomarker discovery studies, even larger cohorts are needed for reliable ROC curve performance estimation and cross-cohort validation. We provide power calculations at project scoping based on available pilot data or published metabolomics variance estimates for your sample matrix.
Yes. We have experience processing and analysing metabolomics data from all major biological matrices — including plasma, serum, urine, cerebrospinal fluid, saliva, faeces, tissue homogenates, cell culture media and cell extracts, and exhaled breath condensate. Each matrix presents distinct analytical challenges — protein depletion in plasma/serum, urine dilution normalisation, tissue homogenisation protocol effects, and the high variability of complex faecal metabolomics. We apply matrix-specific normalisation strategies, blank subtraction protocols, and annotation filtering appropriate to each sample type.
Absolutely. We assist with the metabolomics bioinformatics sections of grant applications — including proposed data processing workflows (XCMS, MZmine3), metabolite annotation methodology, statistical analysis plans, pathway enrichment approaches, multi-omics integration designs, and preliminary metabolomics data. Please contact us as early as possible in the grant preparation process to allow time for any preliminary analyses that would strengthen the scientific case.
Related Research Areas & Services
Metabolomics data analysis connects to multiple complementary services we support.
- Multi-Omics Integration — MOFA+ metabolomics-transcriptomics-proteomics integration, joint KEGG pathway analysis, metabolite-gene correlation networks, and mQTL mapping linking genetic variants to metabolite abundances
- Biomarker Discovery & Validation — Metabolite biomarker panel development, ROC analysis, cross-cohort validation, and companion diagnostic analytical validation for clinical metabolomics applications
- Metagenomics & Microbiome Analysis — Gut microbiome-metabolome integration with mmvec, SCFA and bile acid metabolite profiling, and tryptophan metabolism pathway analysis linking microbial community to host metabolite profiles
- Longevity & Ageing Bioinformatics — NAD+, tryptophan, sphingolipid, and branched-chain amino acid ageing metabolomics panels; metabolomics integration with epigenetic clock biological age acceleration
- Proteomics & Phosphoproteomics — Joint metabolomics-proteomics pathway activity analysis; enzyme activity correlation with metabolite abundance; multi-omics metabolic flux constraint modelling
- Custom Software & Pipeline Development — Bespoke metabolomics analysis platforms, automated XCMS/MZmine processing pipelines, and interactive metabolite network visualisation tools for internal research teams
Ready to Advance Your Metabolomics Research?
Tell us about your mass spectrometry platform, your sample matrix, your experimental design, and your biological or clinical research objectives. Our metabolomics data analysis team will design a tailored bioinformatics plan — typically within 48 hours of your enquiry. Whether you need untargeted LC-MS metabolomics processing and annotation, GC-MS primary metabolism profiling, lipidomics lipid species quantification, metabolite biomarker panel development, pathway enrichment analysis, or multi-omics metabolomics integration, we are here to deliver expert, publication-ready metabolomics results from day one.